 |
 |
Are Those Sunspots Really on the Sun? |
 |
Procedure
Please read the whole procedure, and complete the quiz and group discussion before you begin collecting data. Note that most (but not all!) sunspots appear in groups, so to make things simpler
we will call them sunspot groups, even in cases when there may be just one sunspot.
Quiz
- What are latitude and longitude lines? Can you show them on a solar coordinate grid ?
- What is a magnetogram
and what is an intensitygram?
- Can you find a sunspot or sunspot group on both a magnetogram and an intensitygram?
Discussion
- What do you suppose sunspots are? Do you think sunspots move?
- From your own point of view, are sunspots features on the Sun itself, or objects in orbit around the Sun?
How would you try to prove this? Discuss this in your group.
Collecting Data:
- Decide on whether you want to use magnetograms or intensitygrams.
- Go to SOHO daily images - (http://sohowww.nascom.nasa.gov/data/realtime-images.html).
Magnetograms are labeled "MDI Magnetogram", and intensitygrams
are "MDI Continuum".
- Every day for 10-14 days, either print out a copy of the internet solar image, or sketch and label the image and sunspot groups you see.
(If you have to sketch, try placing the latitude/longitude grid directly over the image on your
screen to find exactly where to sketch your spots. Be careful to always have the image straight up and down.)
Here are some examples of
Galileo's sunspot drawings: http://galileo.rice.edu/sci/observations/sunspot_drawings.html
- For each of the major sunspot group, record on your Sunspot Recording Worksheet:
- The name of each sunspot group. Make up any name you want, but make sure to keep track of which group has which name.
- Where (i.e. at what latitude and longitude) the spot groups lie.
- Note whether there were any observable changes in your sunspot groups (has the group changed size, shape, disappeared altogether?)
You can see a sample completed data sheet here (/images/sunworksheet.gif)
Hints:
- You'll need to track the sunspots for about 2 weeks. Start with images for the current day.
If these aren't complete, start looking at images from previous days.
If you don't have 2 weeks to spare, or if there are no substantial sunspots in the recent images (as is often the case during a solar minimum),
you can look at images from earlier dates.
The easiest way to do this is to go to: http://soi.stanford.edu/production/mag_gifs.html
for magnetograms, and to: http://soi.stanford.edu/production/int_gifs.html
for intensitygrams, and
browse by clicking on the year and month of interest. Another way to obtain archived images is to go to: http://sohodata.nascom.nasa.gov/cgi-bin/data_query.
Enter the start and end dates, and the type of image you want (don't worry about "Latest n images").
Alternatively, you can use these magnetograms in the examples:
(https://solar-center.stanford.edu/solar-images/teacher.html#examples)
- The label on each image indicates the time when it was taken (e.g. for
"2009/02/03 22:29", the date is February 3rd, and the time is 22:29.)
Each day when you retrieve your images, try to get one from the same time as the day before.
- Measure only the large blotches, and don't worry about the smaller dots or
the spread-out areas which look like lace.
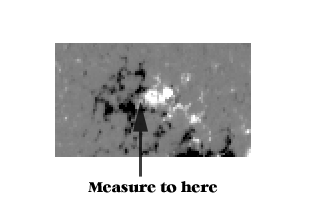
- When you measure the latitude and longitude, measure to the
center of the spot or spot group. On the magnetograms, measure to the area right between the
white and black portions:

|
|
|

