![]()
Home | Introduction | Magnetic Fields | Magnetic Force | Stored Energy in Magnetic Fields | Magnetism on the Sun | Further Exploration | Bibliography
![]()
Magnetic fields can be visualized using magnetic field lines. These lines are curves where:
Equipment:bar magnetsAssembly:
a piece of cardboard much larger than a bar magnet
iron filings
a tableProcedure:
- Place a bar magnet on the table
- Place the cardboard on top of the magnet.
- Scatter the iron filings evenly over the cardboard.
What's Going On?
- Observe the iron filings. Are they pointed in any certain direction? Where do the filings concentrate, near regions of weaker or stronger magnetic field?
- Using the pattern formed by the iron filings as a guide, draw a magnetic field line diagram for the given magnet.
- In your magnetic field line diagram, make note of where the field lines are spread apart or concentrated. Using a pair of magnets, determine which parts of a magnet are stronger or weaker. Establish a relationship between the magnetic forces you felt using the pair of magnets and the concentration of field lines in your diagram.
The magnetic field created by the bar magnet induces a magnetic field in the iron filings. The iron filings become little magnets. Because the iron filings are rod-shaped, they have a tendency to form their poles in a lengthwise direction. As a result, they point in the same direction of applied magnetic field of the bar magnet, just as a compass needle would do when brought next to a magnet.
Magnetic fields on the Earth: The giant bar magnet
Magnetic fields on the Sun
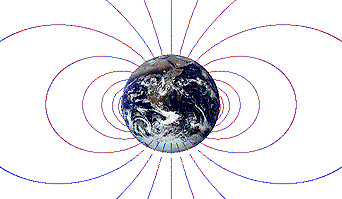
The same pattern that we observed in the magnetic fields experiment can be seen in the Earth. With its global magnetic field, the Earth acts like a giant bar magnet. Since we can't place iron filings around the Earth to observe the magnetic fields, we are going to simulate the fields using a Java applet.
Magnetograms
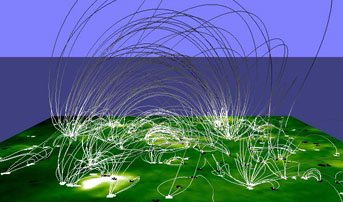
In contrast to the Earth, the Sun has a very weak overall magnetic field (average dipole field). However, the solar surface has very strong and tremendously complicated magnetic fields. Because the surface magnetic fields are so complex, solar scientists use computers and simulate the Sun's magnetic fields, just as we did for the Earth using a Java applet in the previous activity. The image above is from a computer simulation of how the Sun's corona, or outer atmosphere, is heated by its "magnetic carpet." The loops that extend into the corona are magnetic field lines that join the north and south poles in the "magnetic carpet".
Magnetic fields can also be visualized as magnetograms, which are used to make observations of the Sun. Magnetograms are visual representations of the polarity and the strength of magnetic fields that point directly away or towards the observer. Black regions have the strongest southward field (the field points away from the observer and into the Sun), and white regions have the strongest northward field (the field points towards the observer and away from the Sun). Gray areas have little or no magnetic field. One such instrument that generates magnetograms from its observations is the Michelson Doppler Imager (MDI) aboard the SOHO satellite. Daily magnetograms from this instrument are available.
![]()
 Return
To Activities
 |
 |
 |
 |
 |
 |
 |
 |
||||
 |
 |
 |
 |
Last revised by Eugene on August 26, 1999