Accessing SID and AWESOME Data
* Go to the Database *
SID data can be thought of as similar to seismograph data
-- a tracking of signal strength over a period of time. The data format is
little more than a timestamp and a signal strength value. These can be easily
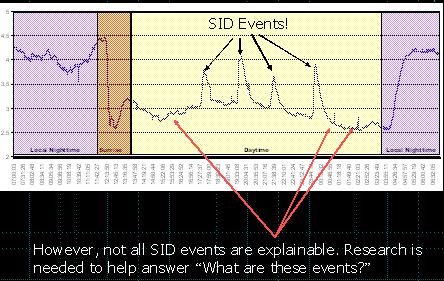
fed into Excel to automatically produce a graph such as:

Note the characteristic sunrise and sunset shapes. The 4
large peaks are events caused by solar activity.
For a tutorial on what to do with your SID data once you have
extracted it from your monitor and sent it to Excel for graphical display,
see:
Getting
Started with SID Data by Shannon Lee (pdf)
This includes information on how to confirm your data with that
from the GOES satellite.
To Upload Your Data
Stanford has set up and is maintaining a centralized data repository where
students can automatically upload and store their data.
Communication is via secure ftp.
Anyone who has obtained a SID monitor through the Stanford Solar Center should have
received the appropriate ftp script and will have a directory set up to allow
contribution of data. The ftp script will daily copy files from your system
Stanford. script can be set up to run automatically on Windows 2000 and XP
systems. Alas, Windows98 does not support automatically-run programs so you would
need to type in the key commands every day or so.
A current copy of the ftp script lives on:
SIDsend.bat
You will need to add your site name to the script and create a directory called "Sent".
Instructions are included within the script itself.
Viewing Data
Stanford is hosting a centralized data repository where students'
data can be automatically stored and retrieved. Numerous sites are already contributing
data to this centralized site. The webpage also includes
direct links to the GOES satellite that is directly monitoring
solar activity.
Database Access