The Ionosphere during a Total Solar Eclipse
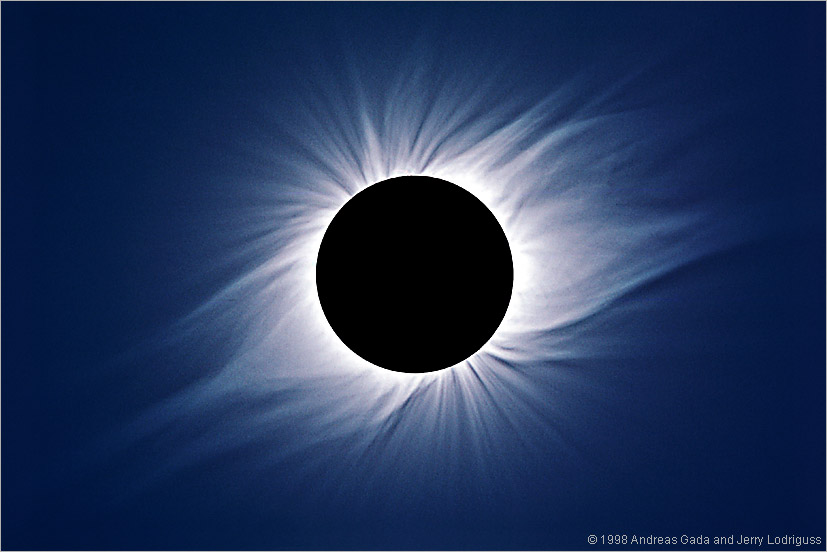
Photo copyright 1998 by Andreas Gada and Jerry Lodriguss
On 1 August 2008, there was a total solar eclipse
visible in the very northernmost regions of the Earth. See
NASA Eclipse Website
Although the path of totality was in very northern areas,
previous research has found that the Earth's ionosphere responds to
eclipses in both hemispheres, on both the day and night side
of the Earth! So SID space weather monitors
in many places of the world should have been able to detect this eclipse.
We hosted a SID campaign for 1 August and have been
collecting data for the eclipse day.
One of our solar researchers, Bala Poduval, is currently analyzing
that data. We will announce the results as soon as they are
available.
To read more about how solar eclipses affect Earth's ionosphere, see:
Arrange to send your SID data to Stanford
The SID monitor software is set up to be able to ftp your data to the centralized
data center at Stanford. Detailed instructions can be found here
and on page 39 of your SID Manual.
If you have an older SID distribution (which may not supply all the needed scripts), you
can easily upgrade to the most recent version, which consists of only 3 files.
It may take a while to download these files,
but the installation is quick and easy. Go to:
http://solar-center.stanford.edu/SID/Distribution/current/
View data at Stanford
Go to http://sid.stanford.edu/database-browser/
The data are easiest to read if you
- Click the "Vertical" buttom
- Set the Graph Size to "Small"
- Then click on "Update Graph"
You can view the data
by going to the site, clicking on the "View Data by Date" option. Then
click on the 1 Aug 2008 date. To separate the graphs for easier viewing, following
the procedures above.
Predictions for the shape of the solar corona during the eclipse, based on
SOHO/MDI data, were available at:
Stanford-Keiji Hayashi
SAIC - Jon Linker