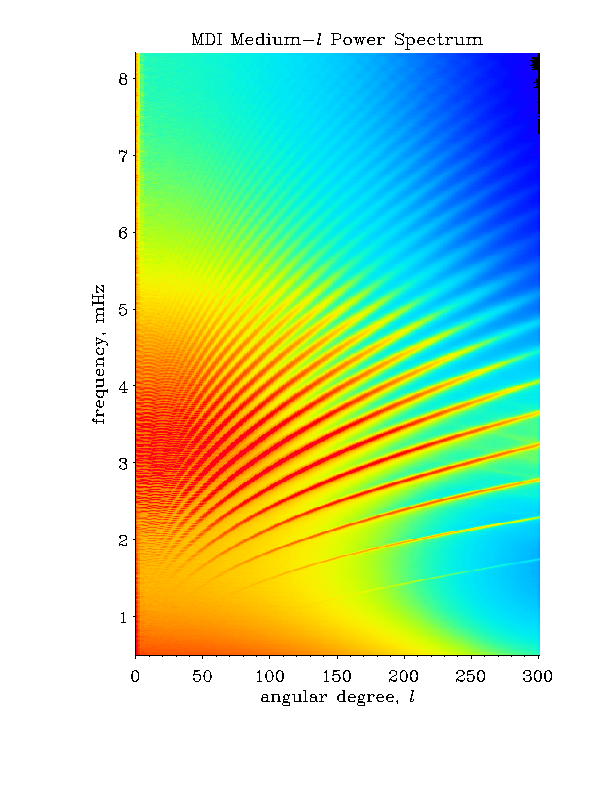

The diagram shows the intensity of the observed oscillations, deduced from the measurements with the SOI/MDI instrument on the SoHO satellite. The horizontal axis shows the degree l of the oscillations, which is a measure of how complicated the oscillation pattern on the solar surface is. The vertical axis shows the frequency in milliherz (mHz) ; a frequency of 3 mHz corresponds to an oscillation period of about 5 minutes. The strength of the oscillations at a given degree and frequency is shown using a colour code : the strongest movements are shown in red and the weakest movements in blue. The oscillation power is concentrated in narrow bands, which correspond to the different values of the order n of the oscillations.
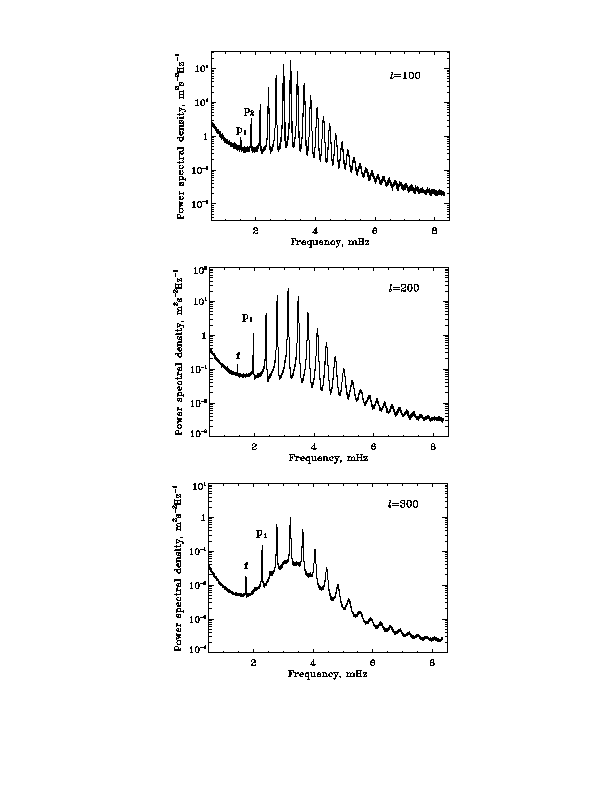
To determine the frequency of the oscillations the intensity is measured as a function of frequency, at given values of the degree l :

This clearly shows the individual peaks, each corresponding to a particular oscillation. The frequencies are then determined from the positions of the peaks.