Visual Art
and Music Based on Solar Data
SOL
Visuals
and Sound from
Florian
Grond, Frank Halbig,
Jesper
Munk Jensen and Thorbjørn Lausten
Florian
Grond, Frank Halbig, Jesper Munk Jensen and Thorbjørn
Lausten are collaborating on a project entitled Sol that
was presented at ZKM Karlsruhe, Karlsruhe, in the Fall of 2004
and was displayed Esbjerg, Denmark May 2005. This project involves
transforming scientific data into media. See Data
of Two Suncycles (http://www.sol-sol.de).
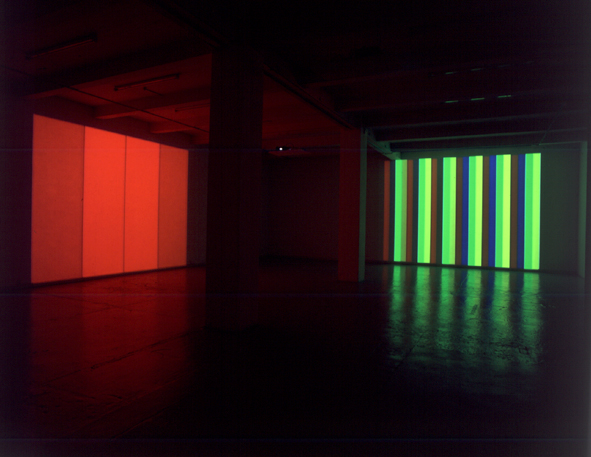
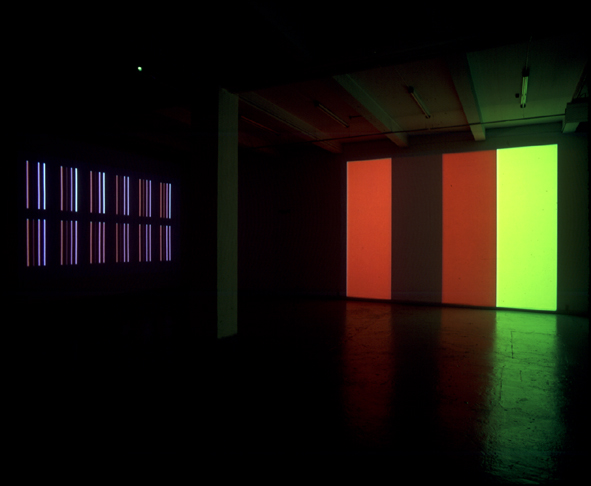
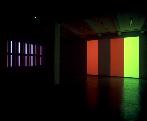
For this project they used solar data spanning the last 20 years.
Four different data sets have been visualized (above, largest
image) as well as audiofied, with each set based on the following
data:
- Front
left: Irradience, the total energy output of the Sun
- Front
Right: The solar wind
- Back
left: Sunspot numbers and positions
- Back
right: The solar magnetic mean field
(The solar
magnetic mean field dataset was taken from the Wilcox
Solar Observatory, part of the Solar Observatories Group
here at Stanford.)
Further Info:
-
Hear
Solar Music Too!
Hear
the Sol solar music at: Data
of Two Suncycles. (Enter the website, then click on the
Video and Sound links.)
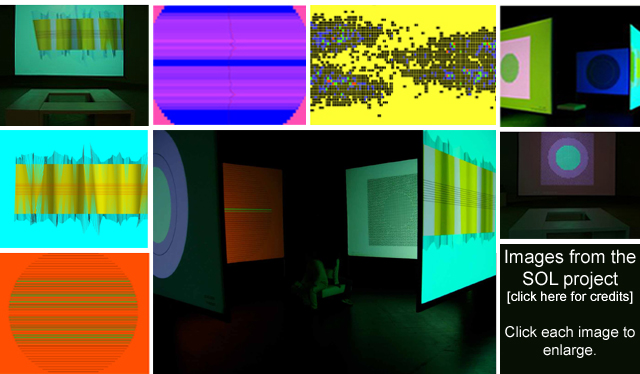
-
Images from the Dataview project.
|
-
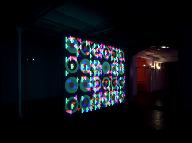
The
project Dataview shows four visualisations of the four
parameters from
Carrington Rotations* that occured from January until September
2003. The idea was to have the solar oscillations described
in the data control the motion of several lamps and filters.
The image projected by these lamps would then change shape and
color according to the movement of the solar surface. The triangle,
cross and square seen in the picture above, left, are controlled
by MDI data taken from different points on the solar surface.
The circles in the front and lines in the rear are controlled
by data from the solar wind. To demonstrate the interaction
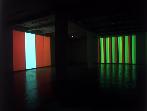
of two different configurations as the data visualizations proceed,
the figure was generated by two DVD-video projections beamed
onto the suspended semi-transparent screen from each side of
the screen.
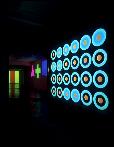
- One projection
consists of four broad bands each of which represents aspects
of the Carrington Rotations. In the other projections, each is
divided into sections consisting of four units which again represent
the four aspects. The projections change every one second or every
half second, each representing one measurement. Each of the four
visualizations was done with a beamer and a DVD player. The duration
was about twenty minutes, then the whole thing was repeated. The
project was done in collaboration with the astophysicist Ib Lundgaard
Rasmussen from the Danish Space Research Institute, Copenhagen.
-
The artist,
Thorbjørn Lausten has had a long interest in the interface
of art, science and technology. He
was a research fellow at the Center for Advanced Visual Studies,
M.I.T.. According to Lausten, "A main intention in doing this
piece, and other pieces with visualization of scientific data,
is that there is an absolute one-to-one relation between data
and visualisazition which, among other thing, means that you give
the image/projection not only an aestetic function, but a function
exactly as exact as the data which are used, or you may say that
you give the image a logical function. I think that a main obstacle
in the discussion about the difference/s between art and science
is that one does not realize that both art and science function
as representations and that mathematics is also a symbolic language.
It has been pointed out by Max Bense that the 'semiotic sign as
such', the concept of 'mathematical figure' and 'the aestetic
state' all belong to the same triadic class of signs as defined
by Pierce, which, in my opinion at least, has very wide ranging
ramifications. Another main intention was to show how important
visualization is in order to understand and construct our world
be it art or science."
* The
number of rotations of the Sun's surface, as seen from the Earth,
since November 9, 1853. The mean period for a single Carrington
rotation is 27.2753 days.
Credits:
Permission to use the images graciously given by Thorbjørn
Lausten. Solar data researched and provided by Jesper Munk Jensen.
Visualizations for SOL done by Florian Grond and Thorbjørn
Lausten. Sonification completed by Frank Halbig in collaboration
with Florian Grond and Thorbjørn Lausten. "Dataview" photography
by Anders Sune Berg. Photograph of the four suspended screens
by Florian Grond.
|
|