|


|
Tracking Solar Flares - Space Weather Monitors
Tracking Solar Flares
Your students might attempt to compare solar flare signatures from
various SID monitors to find out if latitude affects the signatures and
hence the ionospheric response to flares.

To accomplish this, the students would have to establish a "baseline".
That is, not all SID monitors are functioning at the same signal levels,
or even the same time (computer clocks can be off, sometimes by a lot).
Your student will need to compensate for these by "normalizing" the data.
To adjust for time, try comparing the graphs from known solar events
with each other and with data from the GOES satellite.
You may have to adjust the times to allow the events to line up.
To find a list of known flares as detected by the GOES satellites, see
Solar Event Reports -- last 90 days. You can also check the
archive of solar flares on the NOAA website.
Different monitors will also be calibrated slightly differently, thus
having their data values show up between -5 and 5, or -2 and 4, or somesuch.
It is not the absolute values of the
data that are important, rather the size of the change from baseline.
To normalize the data, you will need to scale all the values
down to something, say between 0 and 1.
After normalizing the data, have your students start comparing
graphs from SID monitors at various latitudes.
Are the shapes of the response the same? The timing? The length of the response?
How do the responses differ depending upon the transmitter being tracked?
How do your data compare with the GOES data?
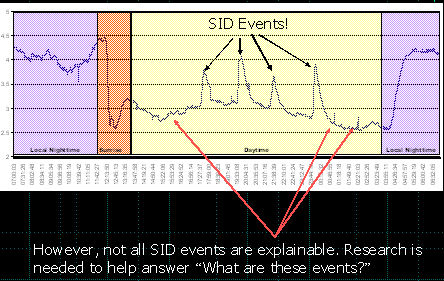
Note that the GOES data is reduced by hand, and often flares are "missed"
being added to the catalog. If your students find disturbances like flare
signatures in their data, they may have found flares overlooked by
the GOES cataloger. Or, they may have found something else.
For any particular unidentified event, have the students first check
the original GOES data
to see if a flare actually occurred but was missed being placed in the catalog.
If not, then they may be picking up electrical interference from
somewhere or something. Most likely it is a local disturbance caused
by somebody turning on a big machine nearby. If certain other sites are picking
up the event as well, then it may have been
caused by a large thunderstorm somewhere between the transmitter and
receiver. Or, if using an AWESOME monitor, they may have picked
up a gamma ray burst. To track these down, have students compare
their local data with other sites' data, both those tracking the same
transmitter and different transmitters. What can they discover based
on which sites showed the event and which didn't? Could they
"triangulate" to determine the potential ionospheric source of the
disturbance?
Note that many of these research ideas work for nighttime
as well as daytime data.
If your students are able to answer any of these questions,
please let us know and we will highlight their research on the website!
|
|