The National Weather Service's Space Weather Prediction Center has satellites (GOES) that track solar flares. Several scientific sites keep lists of these flares. Here is the list that you will use for this activity: We'll show you how to use this list shortly. Finding a Flare to Track
2. What are Good Flares to Choose?
You'll be looking for M-class or X-class flares, which are big.Flares are labeled by their strength, just as earthquakes are. Flares classes have names: A (the tiniest), B, C, M, and X (the biggest). Each category has nine subdivisions, e.g., C1 to C9, M1 to M9, and X1 to X9. These are logarithmic scales, much like the seismic Richter scale. So an M flare is 10 times as strong as a C flare. You can learn more about how flares are classified here
Our SID monitors primarily pick up strong M and X-class flares.
3. Looking for Flares
OK, let's go back to the flare list: Current List of Solar Flares
You should see something like this: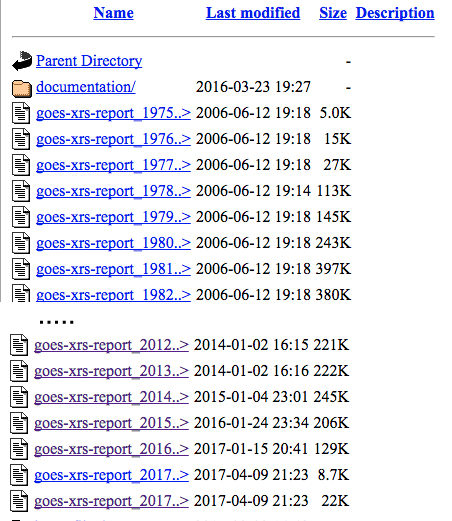
Scroll down to the bottom of the page and pick a recent year. For this example, we'll pick: goes-xrs-report_2015
Now you'll see a screen that looks similar to this:
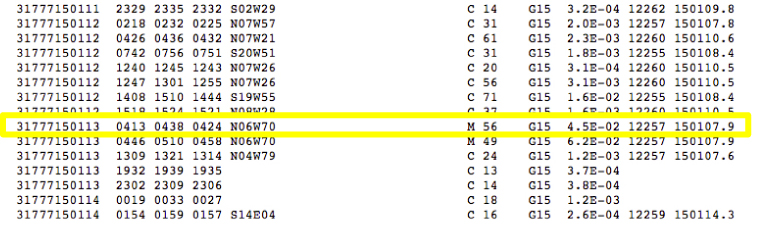
Don't worry about all the numbers. The only ones you care about are in the 1st column (e.g. 31777150101), the 3rd column (e.g. C 21), and the 6th column (e.g. 12253). (We grouped the 4 small columns following the date as one column, #2.)The first column includes the date. For example, 31777150101. Ignore the 31777. So the date for the first data item is 2015 January 1. Each line in the file represents a solar flare.
The items in the 4th column tell you the strength of the flare. SID Monitors primarily pick up flares labeled "M" or "X", the strong ones. Search down the list for an M or X type flare. Since the Sun has a cycle of 11 years, going from almost no flares to lots of flares, and back, there are some years where you won't find any X and only a few M flares. Other years, you may find a lot of them! The last solar maxmum was in 2013, so in the years after that there will be fewer and fewer flares. In our example, let's pick the M 56 flare that occurred on 13 January 2015 (31777150113). The M 56 translates to an M5.6 flare.
Now you get to use the information in the 6th column. Note that the number "12257" appears in the 6th column in our example. This means that the solar flare we picked originated from an Active Region on the Sun that has been labeled 12257. An Active Region is a location on the Sun where strong magnetic fields are appearing at the surface and moving around violently. These are where flares usually occur.
So, in our example, we found an M5.6 flare that occurred on 13 January 2015, and originated from the active region #12257 on the Sun.
4. Now YOU pick a flare to look for!
Now it is your turn to go through this procedure again and pick a flare you would like to track. You'll need to look through various dates in the Current Flare List and look for X-class or M-class flares. You might want to see if any flares occurred on your last birthday, for instance. If a date isn't listed in the catalog, it means there were no flares on that date. Remember that the last solar maximum was 2013, so in the years following there will be fewer and fewer flares.
- Current List of Solar Flares
- Choose a flare from the list.
- Write down your flare's date, size, and active region number.
Once you have picked a flare, go on to Step 3